import copy
import numpy as np
import matplotlib.pyplot as pltTutorial 4: SurEau Basic run
Load modules
from plant_hydraulics.run_sureau import run_sureau
from plant_hydraulics.parameter_classes import (
    SurEauVegetationParams,
    SurEauSoilParams,
    SurEauModelOptions,
)
Climate
from plant_hydraulics.utils import (
    load_example_data,
)
climate_df = load_example_data("climat_example.csv", sep=";")Initialize soil parameters
soil_params = SurEauSoilParams()


soil_params.depth = np.array([0.2, 0.8, 2.0])
soil_params.RFC = np.array([75, 75, 75])
Initialize vegetation parameters
# Create with defaults (Q. ilex)
veg_params = SurEauVegetationParams()
# Leaf area index (m²/m²). Higher = more transpiration.
veg_params.LAI_max = 4.5
veg_params.foliage = "Evergreen"
veg_params.transpiration_model = "Jarvis"
# ψ at 50% loss of leaf conductance (MPa)
veg_params.P50_VC_leaf = -3.4
# ψ at 50% loss of stem conductance (MPa)
veg_params.P50_VC_stem = -3.4
# Steepness of vulnerability sigmoid (%/MPa)
veg_params.slope_VC_leaf = 60
# ψ at 12% stomatal closure (MPa)
veg_params.P12_gs = -2.07
# ψ at 88% stomatal closure (MPa)
veg_params.P88_gs = -2.62
# Whole-plant conductance (mmol/m²/s/MPa)
veg_params.k_plant_init = 0.62
# At 20°C (mmol/m²/s)
veg_params.gmin20 = 4.0
# Temperature where cuticle melts (°C)
veg_params.TPhase_gmin = 37.5
# Q10 above TPhase
veg_params.Q10_2_gmin = 4.8Set modeling options
opts = SurEauModelOptions(
    # Simulation period, must match years in the climate DataFrame
    year_start=1990,
    year_end=1990,

    latitude=43.9,

    # Elevation affects psychrometric constant in ETP calculation
    elevation=0,

    # Print progress to console
    print_progress=True,
)
Run the model
results = run_sureau(
    climate_df=climate_df,
    veg_params=veg_params,
    soil_params=soil_params,
    opts=opts,

    # Set True to keep deepest layer at field capacity
    deep_water=False,
)
Year 1990 complete. Plot results
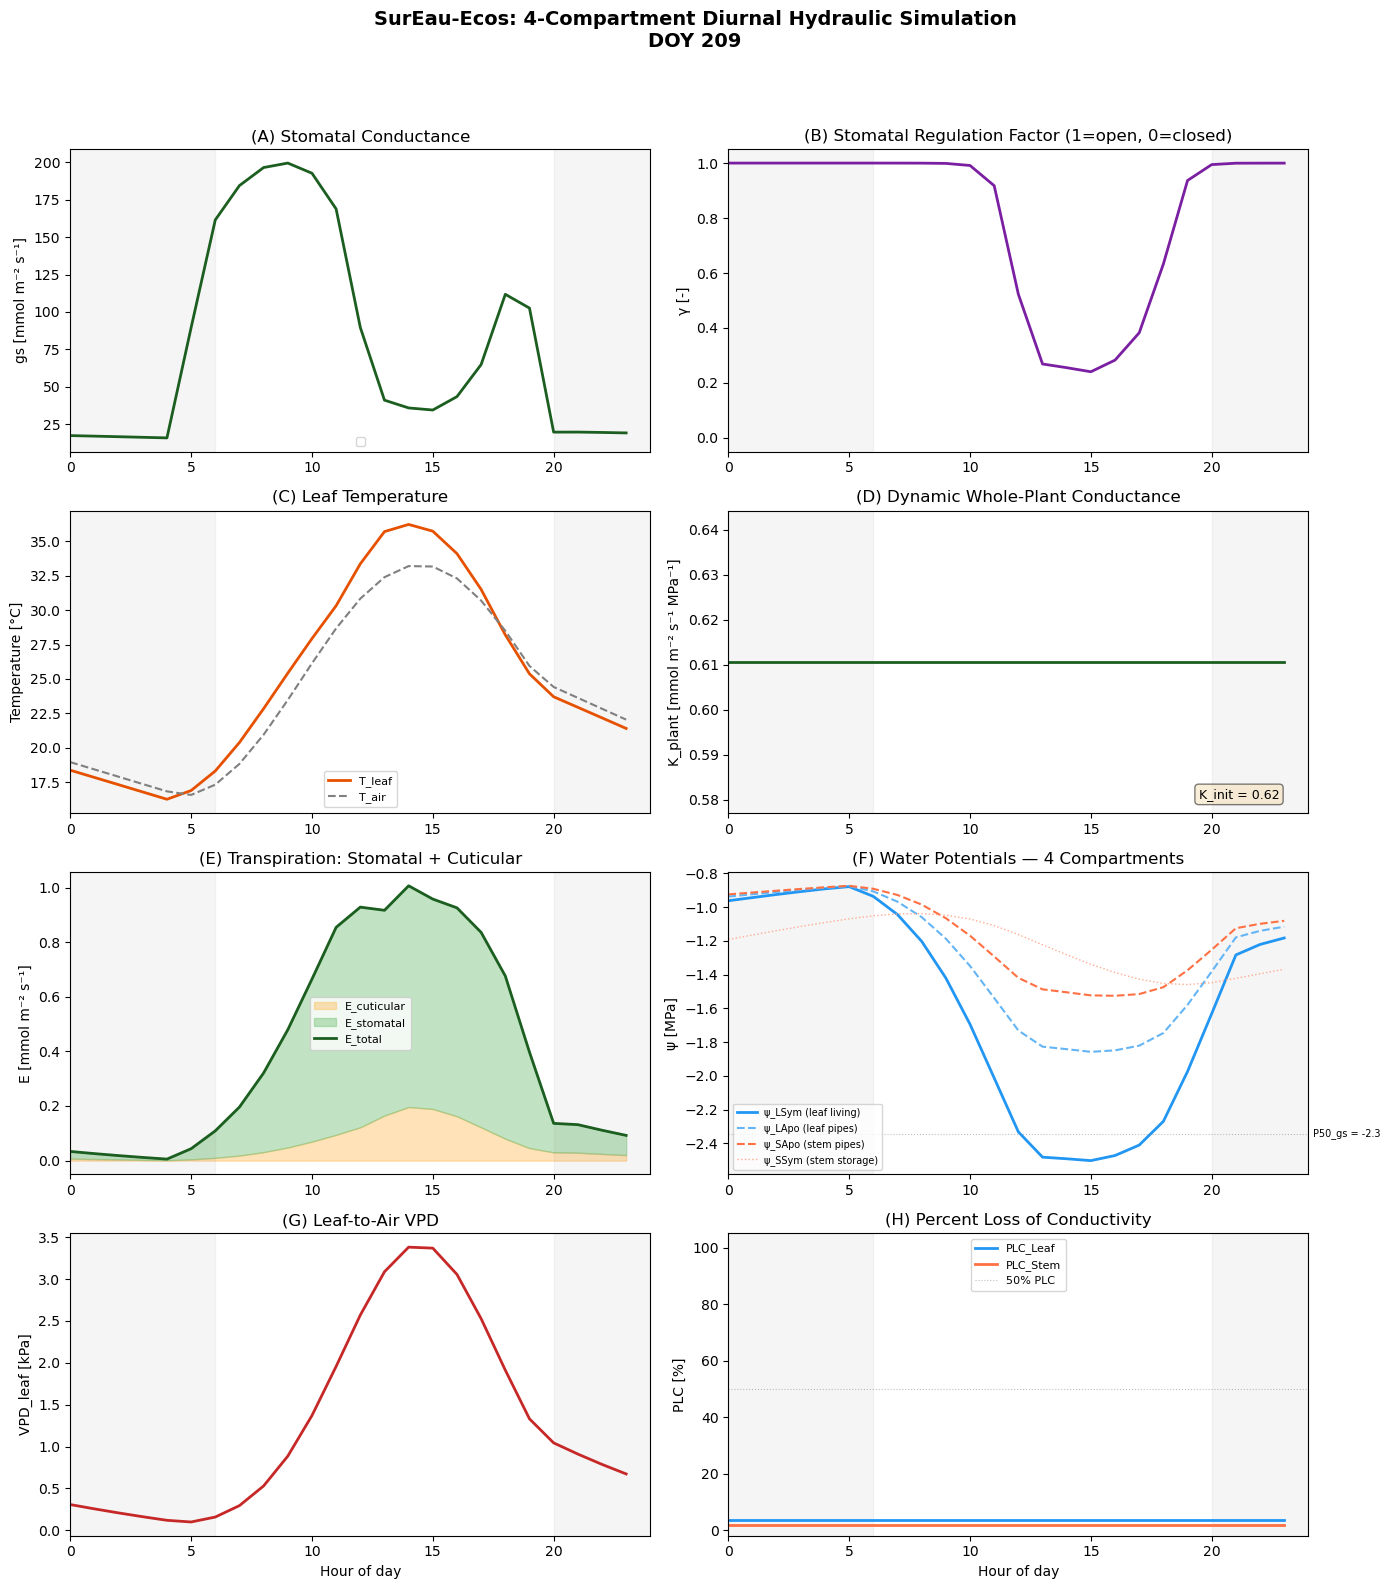
  Plotting DOY 209 (July 28, 1990)
  Hours available: 24
  Min ψ_LSym this day: -2.503 MPa
  Min regul_fact: 0.241
/tmp/ipykernel_31553/4151902588.py:43: UserWarning: No artists with labels found to put in legend. Note that artists whose label start with an underscore are ignored when legend() is called with no argument.
ax.legend(fontsize=8)